
On the waterfront
2020
Artist Statement: Utilising a combination of images created using publicly available Google Earth satellite imagery and photographs captured by the artist, ON THE WATERFRONT examines some of the world's largest port operations in exquisite detail as an insight into globalisation. The efforts of modern ports to improve efficiency, increase capacity and drop costs have resulted in impressive displays of engineering and logistics which can only truly be appreciated when viewed from above. The resulting images reveal mesmerising patterns and colours, and incredible scale, clearly revealing the mechanics behind this often overlooked industry.
90% of the items we consume are shipped across the seas in containers. Increasing global demand has seen the emergence of ever growing 'mega ports', handling tens of millions of containers a year.

Bremerhaven, Germany.

Port of Rotterdam, Netherlands V.
Of the world’s 4,500 ports, the port of Shanghai was the busiest container port in the world, handling about 42 million containers of cargo in 2018. China dominates the world's shipping industry with 13 of the world's 20 largest ports.

Port of Shanghai, China

Port of Shenzhen, China
One large container ship can move around 200,000 containers in a year with cargo worth over $4.5B. There are estimated to be more than 60,000 container ships in operation worldwide, together transporting more than 500 million containers a year. Only 2% of containers are inspected.


The quantity of goods carried by containers has risen from around 102 million metric tons in 1980 to about 1.83 billion metric tons in 2017.

Port of Rotterdam, Netherlands.

Port of Rotterdam, Netherlands IV.

Port of Singapore, Singapore.
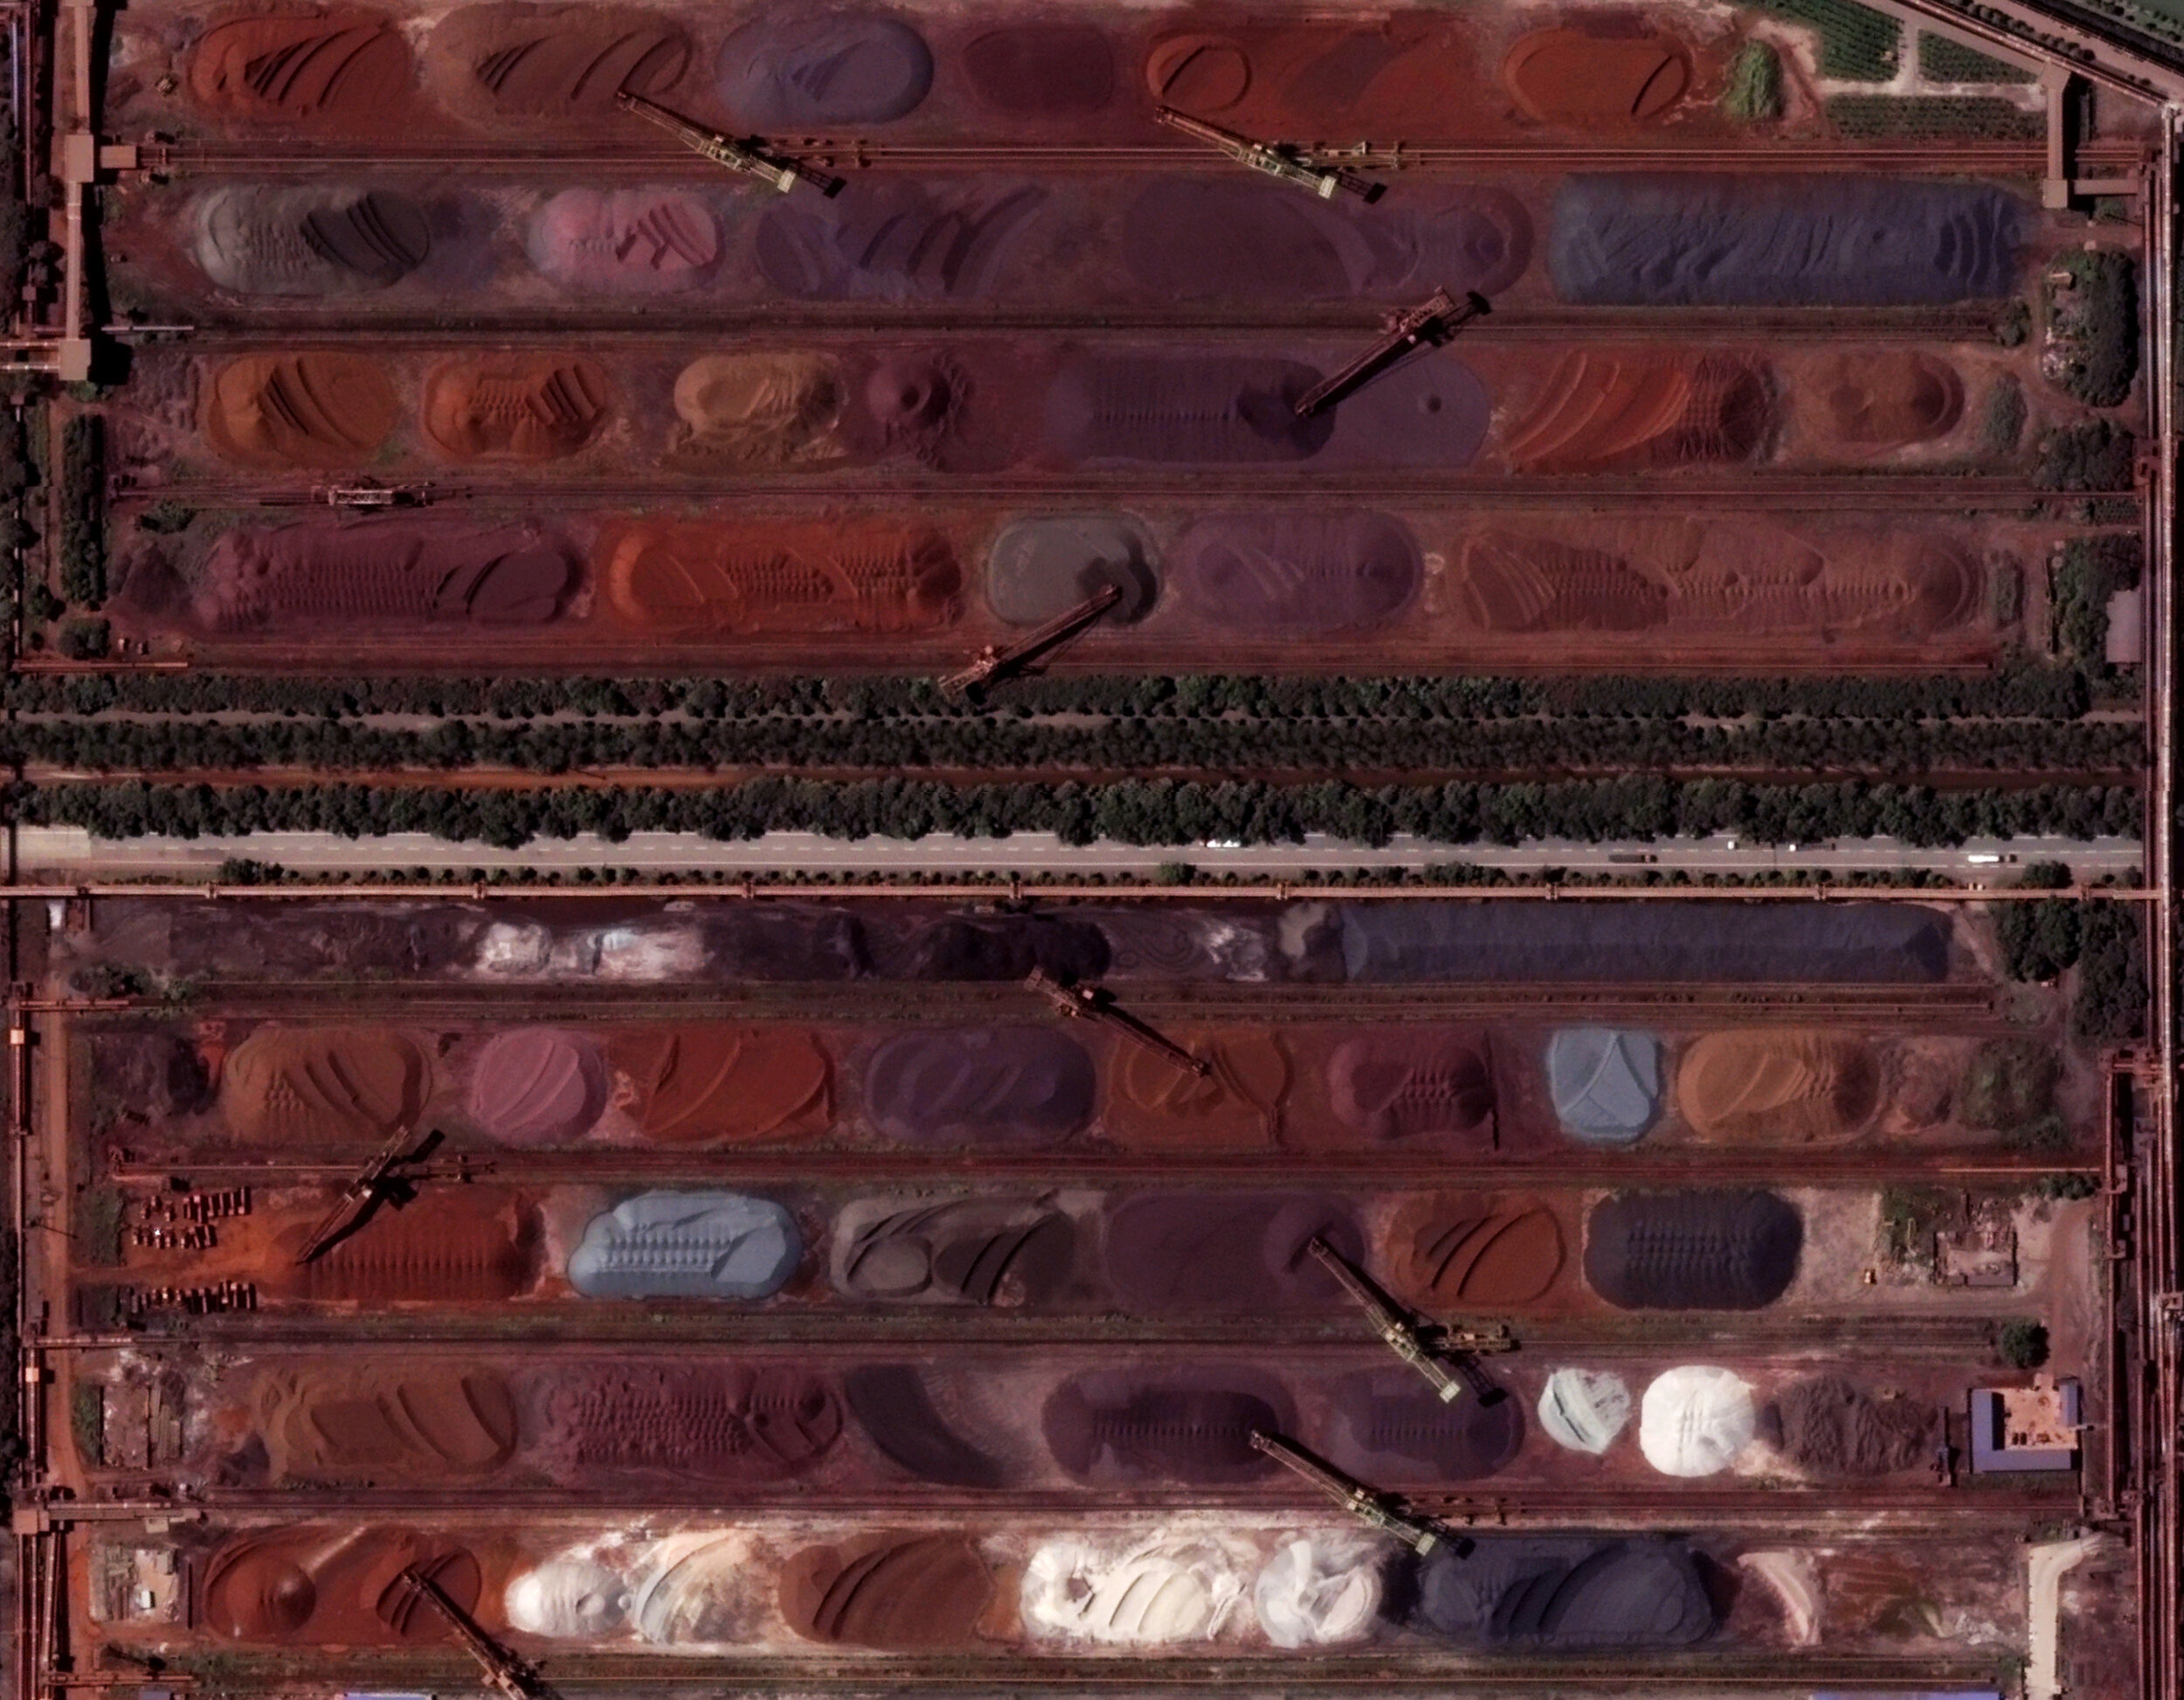
Australia is responsible for 50% of the world’s iron exports.

Cape Lambert, Western Australia.

Port Headland, Western Australia.
Massive amounts of steel and aluminium are shipped around the world to be used in the production of automobiles, ships, machinery and large scale construction projects as well as coal for energy production. The port of Ningbo-Zhoushan, China moved more than 1 billion tonnes of cargo in 2017, most of which was dry bulk such as iron and coal.

Port of Ningbo-Zhoushan, China.

Port of Tianjin, China

Port of Shanghai, China

Port of Rotterdam, Netherlands III.

Port of Tangshan, China.
Port of Shanghai, China VI.
Europe imported more than 15 million barrels of oil a day in 2018, an all time high at the time.

Port of Rotterdam, Netherlands VI.


The United States of America has exported close to 2 million vehicles per year for the last 5 consecutive years, worth around 55 billion dollars a year. Depicted below is the same car park at The Port of Los Angeles, USA where cars are loaded for export, captured over a period of 10 years.

Port of Los Angeles, USA, I-III.

Port of Los Angeles, USA, IV-VI.

Port of Los Angeles, USA, VII-IX.
Check out the virtual exhibition of this project over at artsteps.com.
series By Peter Bjoerk
Contributors
Google Earth
Kevin McMillan
Ger Treacy
Kevin Fox